![AIM Logo Final White RGB@2x.png]](https://3437204.hs-sites.com/hs-fs/hubfs/AIM%20Logo%20Final%20White%20RGB@2x.png?height=50&name=AIM%20Logo%20Final%20White%20RGB@2x.png)
Use the Billing Statistics Dashboard to verify that common billing workflows are followed and backlogs are being worked timely.

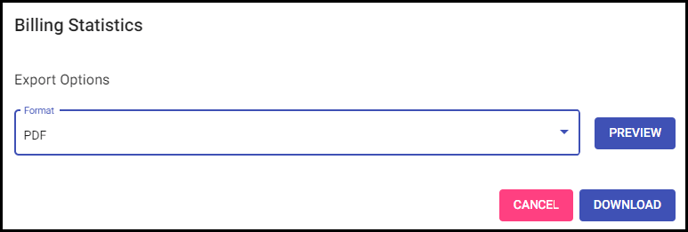
Billing Statistics Dashboard Report Criteria
Bill Status Table
This table displays bill counts for each category without having to run each report individually.

Billing Data Entry Statistics for Current Month Table
This table displays the current month's bill counts and charges for new bills and printed/transmitted bills, as well as the count and amount for transactions posted in the current month.

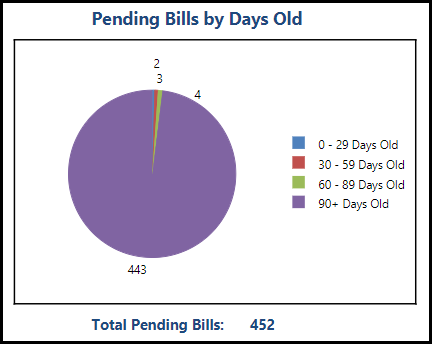
Pending Bills by Days Old Pie Chart
This chart displays Pending Bills information by days old (based on the date billed) as a quick reference.
Pending Amount by Days Old Pie Chart
This chart displays Pending Amount information by days old (based on the date billed) as a quick reference.

Pending Bills by Payer Category Pie Chart
This chart displays Pending Bills information by payer category (based on the date billed) as a quick reference.

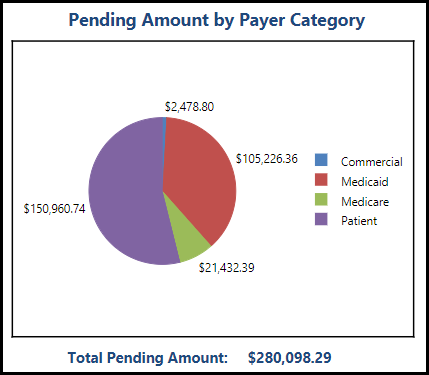
Pending Amount by Payer Category Pie Chart
This chart displays Pending Amount information by payer category (based on the date billed) as a quick reference.
The bottom of each page of the report will contain the date/time the report was ran.