![AIM Logo Final White RGB@2x.png]](https://3437204.hs-sites.com/hs-fs/hubfs/AIM%20Logo%20Final%20White%20RGB@2x.png?height=50&name=AIM%20Logo%20Final%20White%20RGB@2x.png)
Accessing the Report
Navigate to Admin > Productivity Reports and select Monthly A/R by Transaction Date Report.
Report Criteria

Year: Enter the desired year. The report uses a date range of 1/1 - 12/31 for the entered year and also provides data for the previous calendar year.
Agency: Multi-select dropdown with Select All/Unselect All options. Limited to agencies within the current customer.
This report can be saved and scheduled.
Report Output
The report includes the previous calendar year alongside the entered year to support year-over-year comparison of A/R activity and payment trends for all selected agencies.

Report header displays the report name, run date/time, company name/address, and transaction date range.
A separate section is generated for each selected agency, each containing a monthly table and chart.
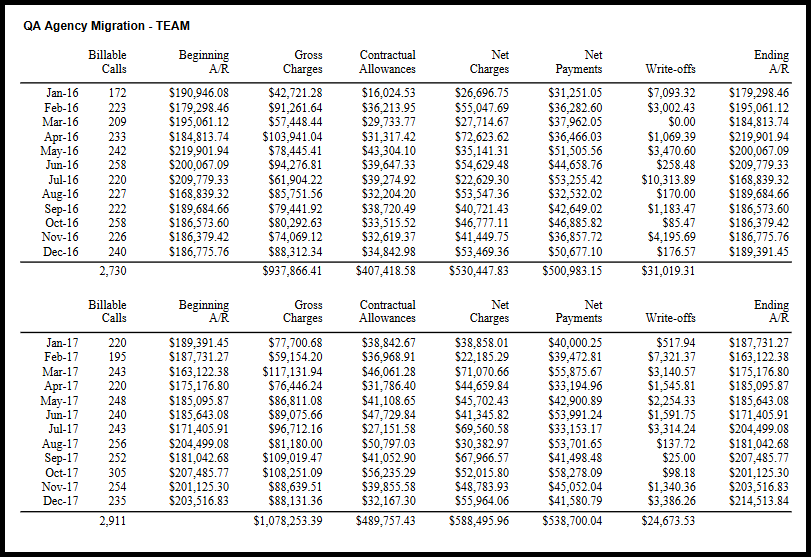
Monthly Table: Rows are displayed in YR-MM format, grouped by calendar year. Each year includes a yearly total row. Future months within the date range display with no data. Columns include:
Billable Calls — Count of claims billed in that month (not based on date of service).
Beginning A/R — Accounts receivable balance at the start of the month.
Total Charges — Total charges posted during the month.
Contractual Allowances — Total contractual allowances posted during the month.
Net Charges — Gross charges minus contractual allowances.
Total Payments — Total payments posted during the month.
Write-offs — Total write-offs posted during the month.
Ending A/R — Accounts receivable balance at the end of the month.

Chart: A monthly payments line chart appears below the table for each agency. The chart compares payment amounts month-over-month across years. The X-axis displays months (Jan–Dec), the Y-axis displays dollar amounts, and each year is represented as a separate line.